Configure Metrics in Pomerium Enterprise
Learn how to configure Prometheus as a metrics collection backend in Pomerium Enterprise.
Overview
Pomerium Enterprise uses Prometheus to collect observability and monitoring metrics from your Pomerium deployment. To set up Pomerium to work with Prometheus, you must configure either an external or embedded Prometheus instance.
This guide explains what the external and embedded Prometheus options are, and how to configure them.
Before you start
To complete this guide, you need:
This guide runs both Pomerium instances on localhost (127.0.0.1).
Configure Pomerium
In your Pomerium Enterprise configuration file, define the metrics_addr key to a network interface or port:
metrics_addr: 127.0.0.1:9092
This setting exposes internal metrics within the Enterprise Console. If not defined, Pomerium will expose 127.0.0.1 on port :9092 by default.
Configure Prometheus
External Prometheus
An external Prometheus instance runs as its own process separate from Pomerium. Use this option if you prefer to configure and maintain Prometheus yourself.
The steps below show you how to connect Prometheus to Pomerium Core and Pomerium Enterprise.
For production deployments, we suggest using a dedicated Prometheus instance.
-
In your Prometheus configuration file, add instances for Pomerium and Pomerium Enterprise:
prometheus.yaml- job_name: 'Pomerium'
scrape_interval: 30s
scrape_timeout: 5s
static_configs:
- targets: ['127.0.0.1:9091']
- job_name: 'Pomerium Enterprise'
scrape_interval: 30s
scrape_timeout: 5s
static_configs:
- targets: ['127.0.0.1:9092'] -
Reload the Prometheus configuration:
curl -i -XPOST path.to.prometheus:port/-/reload -
In your Pomerium Enterprise configuration file, define the
prometheus_urlkey to point to your Prometheus instance. The example below uses port 9090, the default Prometheus port.pomerium-enterprise.yamlprometheus_url: http://192.168.122.50:9090 -
In your Pomerium configuration file, define the
metrics_addresskey to a network interface or port. In the example below, Pomerium provides metrics at port9091on an IP address reachable by Pomerium Enterprise:pomerium.yamlmetrics_address: 127.0.0.1:9091noteIf you're running Pomerium Enterprise in a distributed environment where the IP address is unknown at the time of deployment, you can use the resolvable fully qualified domain name (FQDN) of the Pomerium host (for example,
pomerium0.internal.example.com). Or, you can override this key with theMETRICS_ADDRESSenvironment variable.We do not recommend exposing this endpoint to public traffic as it can contain potentially sensitive information.
Embedded Prometheus
Pomerium Enterprise supports an embedded Prometheus instance that you configure only in Pomerium. Use this option if you don't want to maintain an external Prometheus instance, or if you're testing metrics.
To configure an embedded Prometheus instance, add the prometheus_data_dir key and file path in your Pomerium Enterprise configuration file:
prometheus_data_dir: /var/lib/pomerium-console/tsdb
The directory path can be any location that you have permissions to write to. This example uses the default location created if you install Pomerium Enterprise with the OS Packages option.
Test the configuration
To view metrics collected by Prometheus, you must restart the Pomerium and Pomerium Enterprise services.
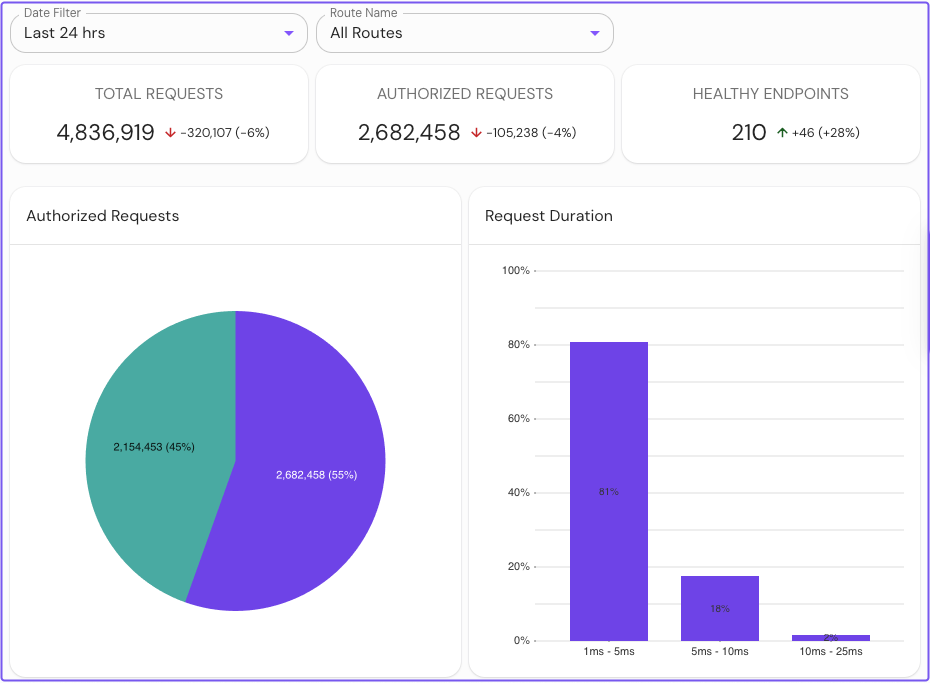
In the Enterprise Console, select Traffic. You should see route traffic metrics collected from your Pomerium deployment:
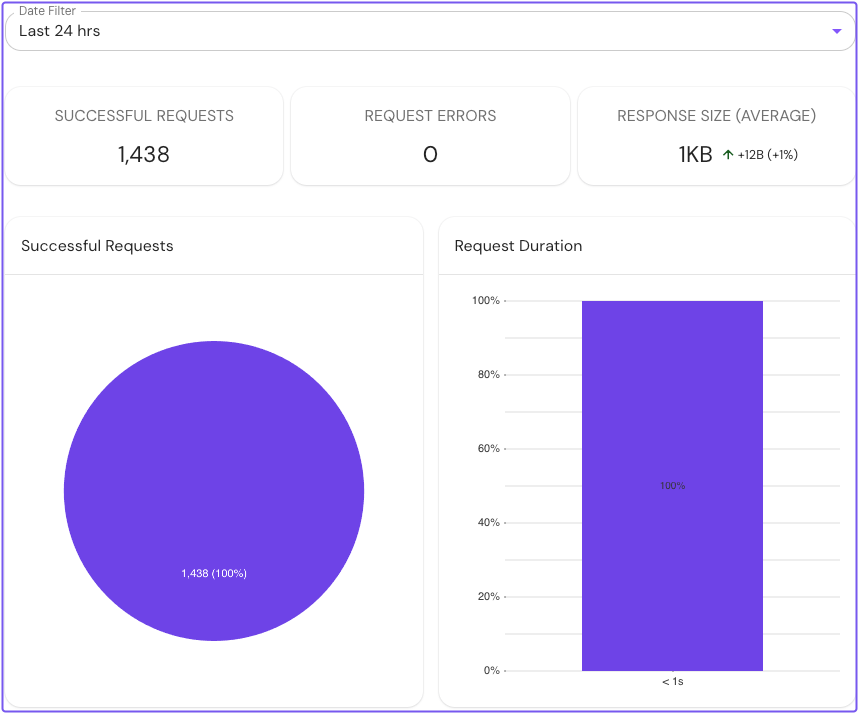
To view monitoring metrics for an external data source:
-
Select External Data.
-
Select an external data source.
-
Select the Metrics tab. You should see monitoring data collected from the external data source record: