Health Checks
This page provides an overview of how to configure internal health checks on Pomerium instances.
Health checks allow you to automatically monitor Pomerium instances and restart or replace them if they become unresponsive or fail. In Kubernetes, it ensures smooth rollout of deployments by waiting for instances to become healthy before terminating the old ones. On startup, these health checks primarily signal that the Pomerium instance is ready to receive traffic.
Overview
In Pomerium, these health checks will report on the status of:
- Readiness and health of the embedded Envoy instance
- Health of the configuration syncing mechanisms
- Health of the configuration management server
- Storage backend health, where applicable
HTTP Probes
HTTP health checks may not suit all environments. For instance, in environments with limited database connectivity or reliability, they can trigger undesired probe failures. Consider using the exclude filters with the CLI probe instead.
Pomerium exposes http probe endpoints on 127.0.0.1:28080 by default. This server exposes /status, /startupz, /readyz and /healthz for consumption by container orchestration frameworks, like Kubernetes.
For an overview on how probes work with Kubernetes see the upstream documentation and their configuration options.
To configure these for automatic checks in kubernetes on your pomerium instance you can add to your deployment manifest:
containers:
  - name: pomerium
    # ...
    startupProbe:
      httpGet:
        path: /startupz
        port: 28080
    livenessProbe:
      httpGet:
        path: /healthz
        port: 28080
      initialDelaySeconds: 15
      periodSeconds: 60
      failureThreshold: 10
    readinessProbe:
      httpGet:
        path: /readyz
        port: 28080
      initialDelaySeconds: 15
      periodSeconds: 60
      failureThreshold: 5
Startup
The startup endpoint /startupz waits for all components to report ready - in practice the latest version of the configuration should be synced before starting.
Readiness
The /readyz endpoint ensures that all components are in the RUNNING state and healthy.
If any component reports an error or enters the terminating state, it is treated as a failure.
Liveness
The /healthz endpoint verifies that all components are functioning properly. It also treats the terminating state as healthy to support graceful shutdown.
If any component reports an error, it is treated as a failure.
Debugging
If your pods are frequently restarted due to failed checks, the endpoints provide human-readable status reports from Pomerium. For example:
{
  "authenticate.service": {
    "status": "RUNNING"
  },
  "authorize.service": {
    "status": "RUNNING"
  },
  "config.databroker.build": {
    "status": "RUNNING"
  },
  "databroker.sync.initial": {
    "status": "RUNNING"
  },
  "envoy.server": {
    "status": "RUNNING"
  },
  "proxy.service": {
    "status": "RUNNING"
  },
  "storage.backend": {
    "status": "RUNNING",
    "attributes": [
      {
        "Key": "backend",
        "Value": "in-memory"
      }
    ]
  },
  "xds.cluster": {
    "status": "RUNNING"
  },
  "xds.listener": {
    "status": "RUNNING"
  },
  "xds.route-configuration": {
    "status": "RUNNING"
  }
}
which can help identify which component(s) are unhealthy and surface errors, which can help point to remediation steps.
If your instance often reports unhealthy components but still serves traffic normally, consider using CLI-based probe checks in Kubernetes and apply their filter feature.
CLI
Pomerium images include the pomerium binary, which provides a health subcommand. This command exits with status 1 if the instance is unhealthy, and 0 if healthy.
The CLI health check can be used in environments like Docker Compose and ECS. See the Compose documentation and ECS documentation for details.
Usage:
  pomerium health [flags]

Flags:
  -e, --exclude stringArray   list of health checks to exclude from consideration
  -a, --health-addr string    port of the pomerium health check service (default "127.0.0.1:28080")
  -h, --help                  help for health
  -v, --verbose               prints extra health information
An example configuration for Pomerium in docker compose looks like:
healthcheck:
  interval: 30s
  retries: 5
  test:
    - CMD
    - pomerium
    - health
  timeout: 5s
In Kubernetes you can deploy like:
livenessProbe:
  containers:
    - name: pomerium
      # ...
      livenessProbe:
      exec:
        command:
          - pomerium
          - health
          - a
          - $(POD_IP):28080
      initialDelaySeconds: 5
      periodSeconds: 30
      timeoutSeconds: 5
Filters
Unlike HTTP probes, the CLI provides additional flexibility through exclude filters, which let you ignore specific internal conditions reported by Pomerium when evaluating health.
For example:
pomerium health -e storage.backend -e config.databroker.build
This command returns exit code 0 even if the storage backend or configuration build is reported as unhealthy.
Debugging
For debugging, use the -v verbose flag to display the status reported by Pomerium:
pomerium health -v
{
  "statuses": {
    "authenticate.service": {
      "status": "RUNNING"
    },
    "authorize.service": {
      "status": "RUNNING"
    },
    "config.databroker.build": {
      "status": "RUNNING"
    },
    "databroker.sync.initial": {
      "status": "RUNNING"
    },
    "envoy.server": {
      "status": "RUNNING"
    },
    "proxy.service": {
      "status": "RUNNING"
    },
    "storage.backend": {
      "status": "RUNNING",
      "attributes": [
        {
          "Key": "backend",
          "Value": "in-memory"
        }
      ]
    },
    "xds.cluster": {
      "status": "RUNNING"
    },
    "xds.listener": {
      "status": "RUNNING"
    },
    "xds.route-configuration": {
      "status": "RUNNING"
    }
  },
  "checks": [
    "authenticate.service",
    "storage.backend",
    "databroker.sync.initial",
    "xds.cluster",
    "xds.route-configuration",
    "envoy.server",
    "authorize.service",
    "config.databroker.build",
    "proxy.service",
    "xds.listener"
  ]
}
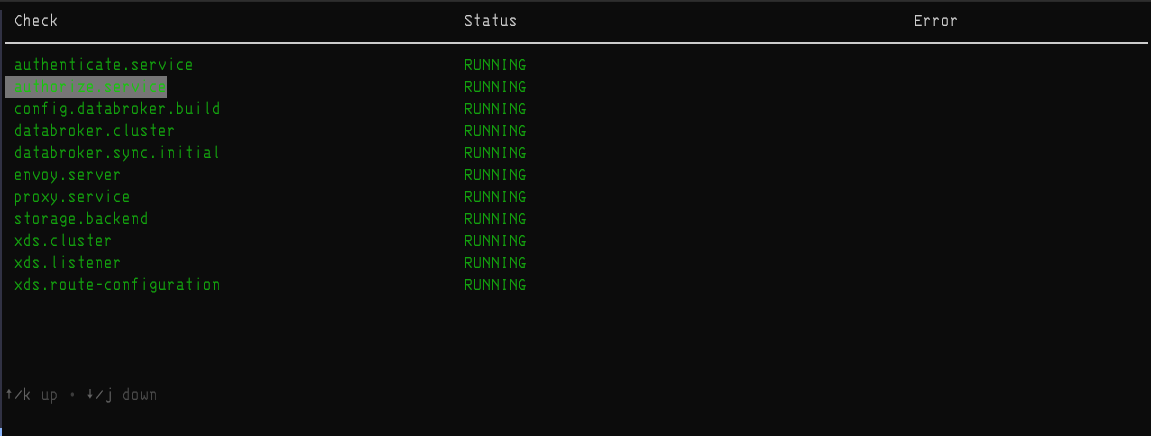
TUI
The health check CLI has a TUI mode that follows live health updates from the terminal:
pomerium health watch -a <grpc_address> -s <shared_secret>
where <grpc_address> is the grpc_address set in your config file and shared_secret is the shared_secret set in your config file.
Systemd
When running Pomerium via systemd, health checks are automatically configured. Pomerium communicates its health status to systemd using the sd_notify protocol.
You can view the status with:
systemctl status <pomerium-service-name>
If the service is unhealthy, an error with details will be displayed in the status section.
Disabling
By default, the Pomerium systemd service includes:
[Service]
Type=notify
#...
WatchdogSec=30s
To disable systemd health checks, remove these options from the service configuration.
Additionally, since Pomerium sends sd_notify messages when started via systemd, you can explicitly disable this behavior by adding the following to your config.yaml:
health_check_systemd_disabled: true
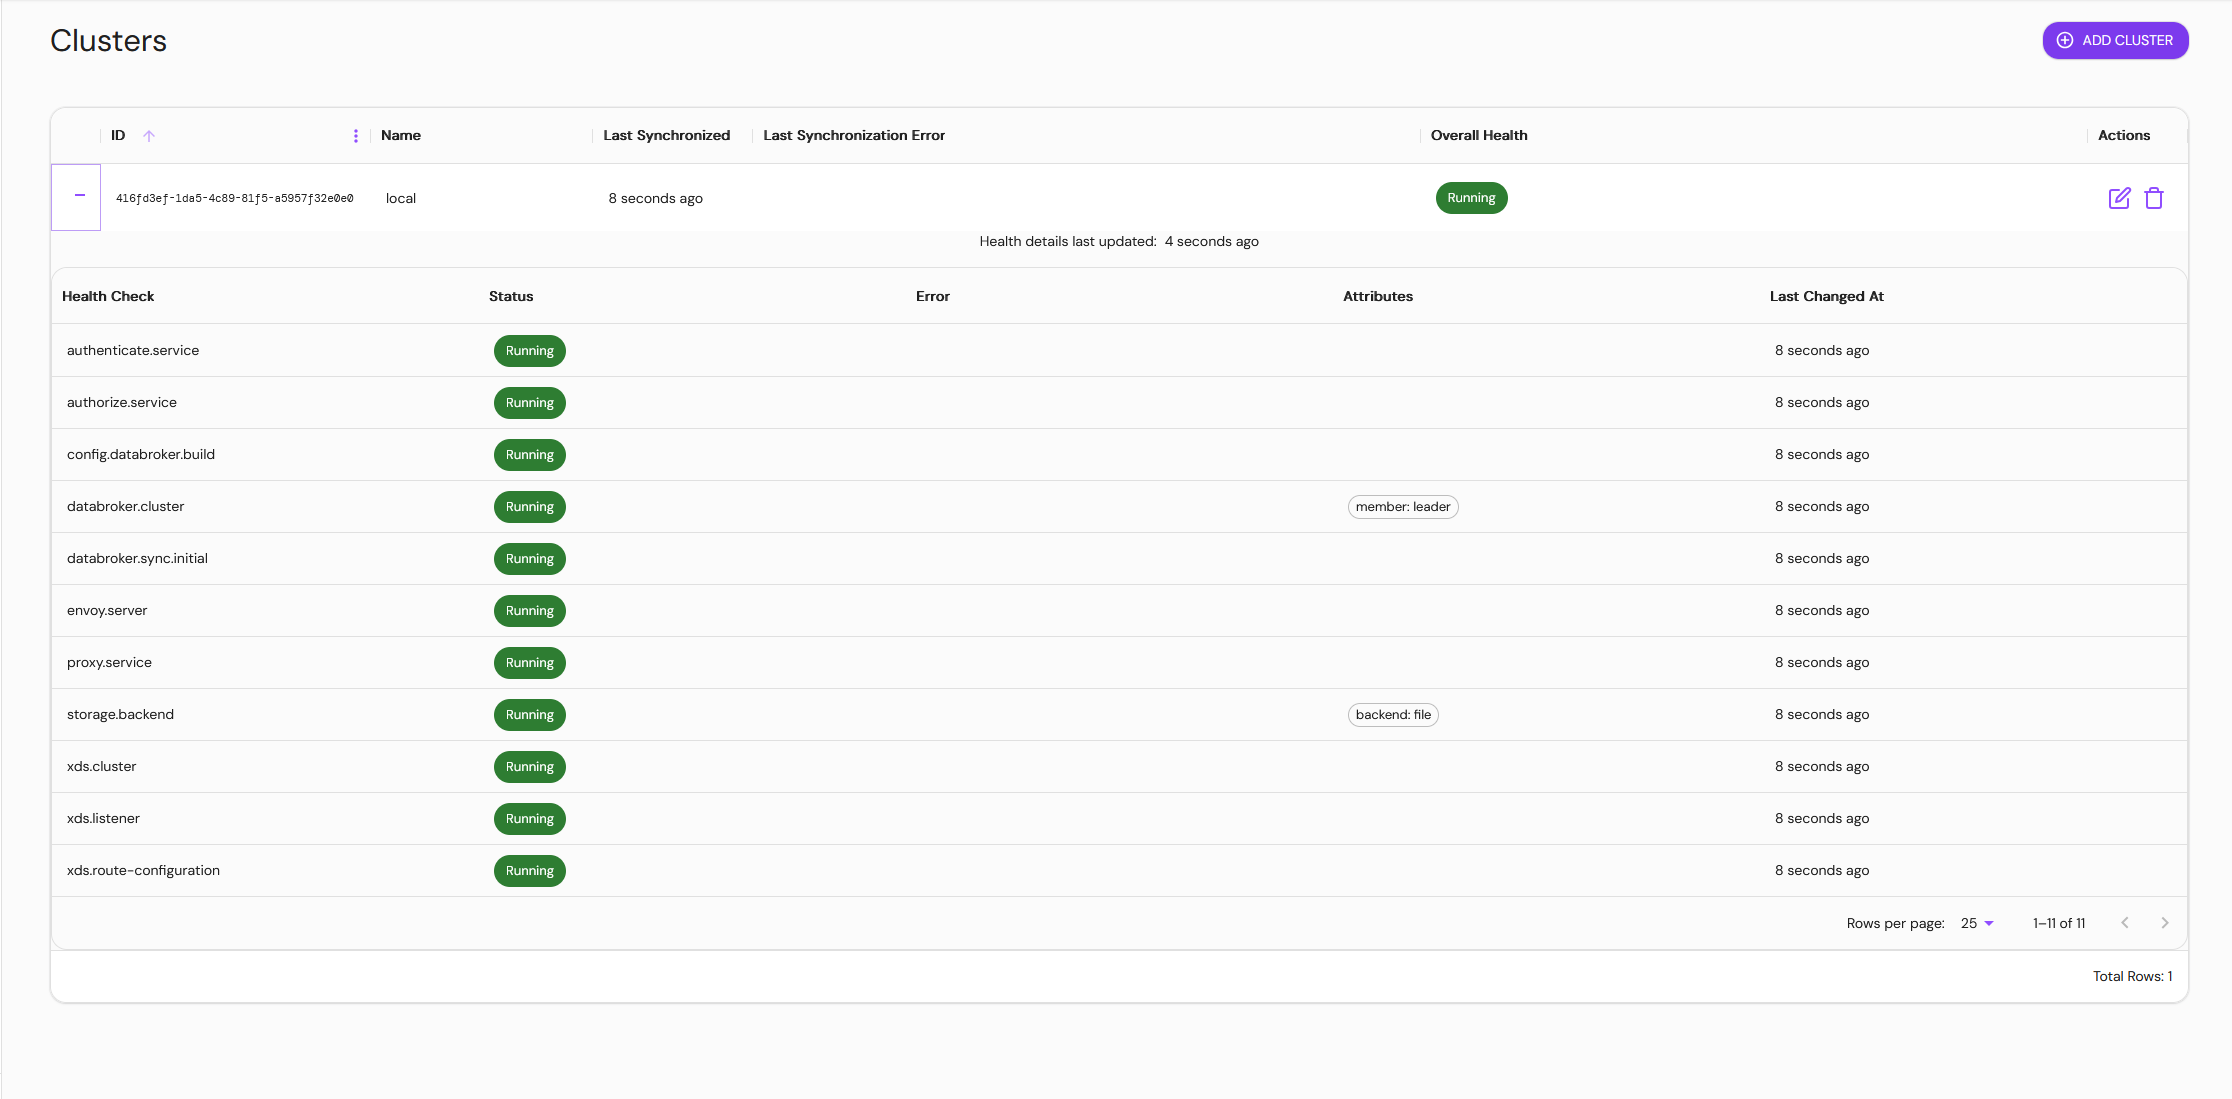
For Enterprise
In Pomerium Enterprise, synced clusters' health details will automatically be displayed in the UI :::